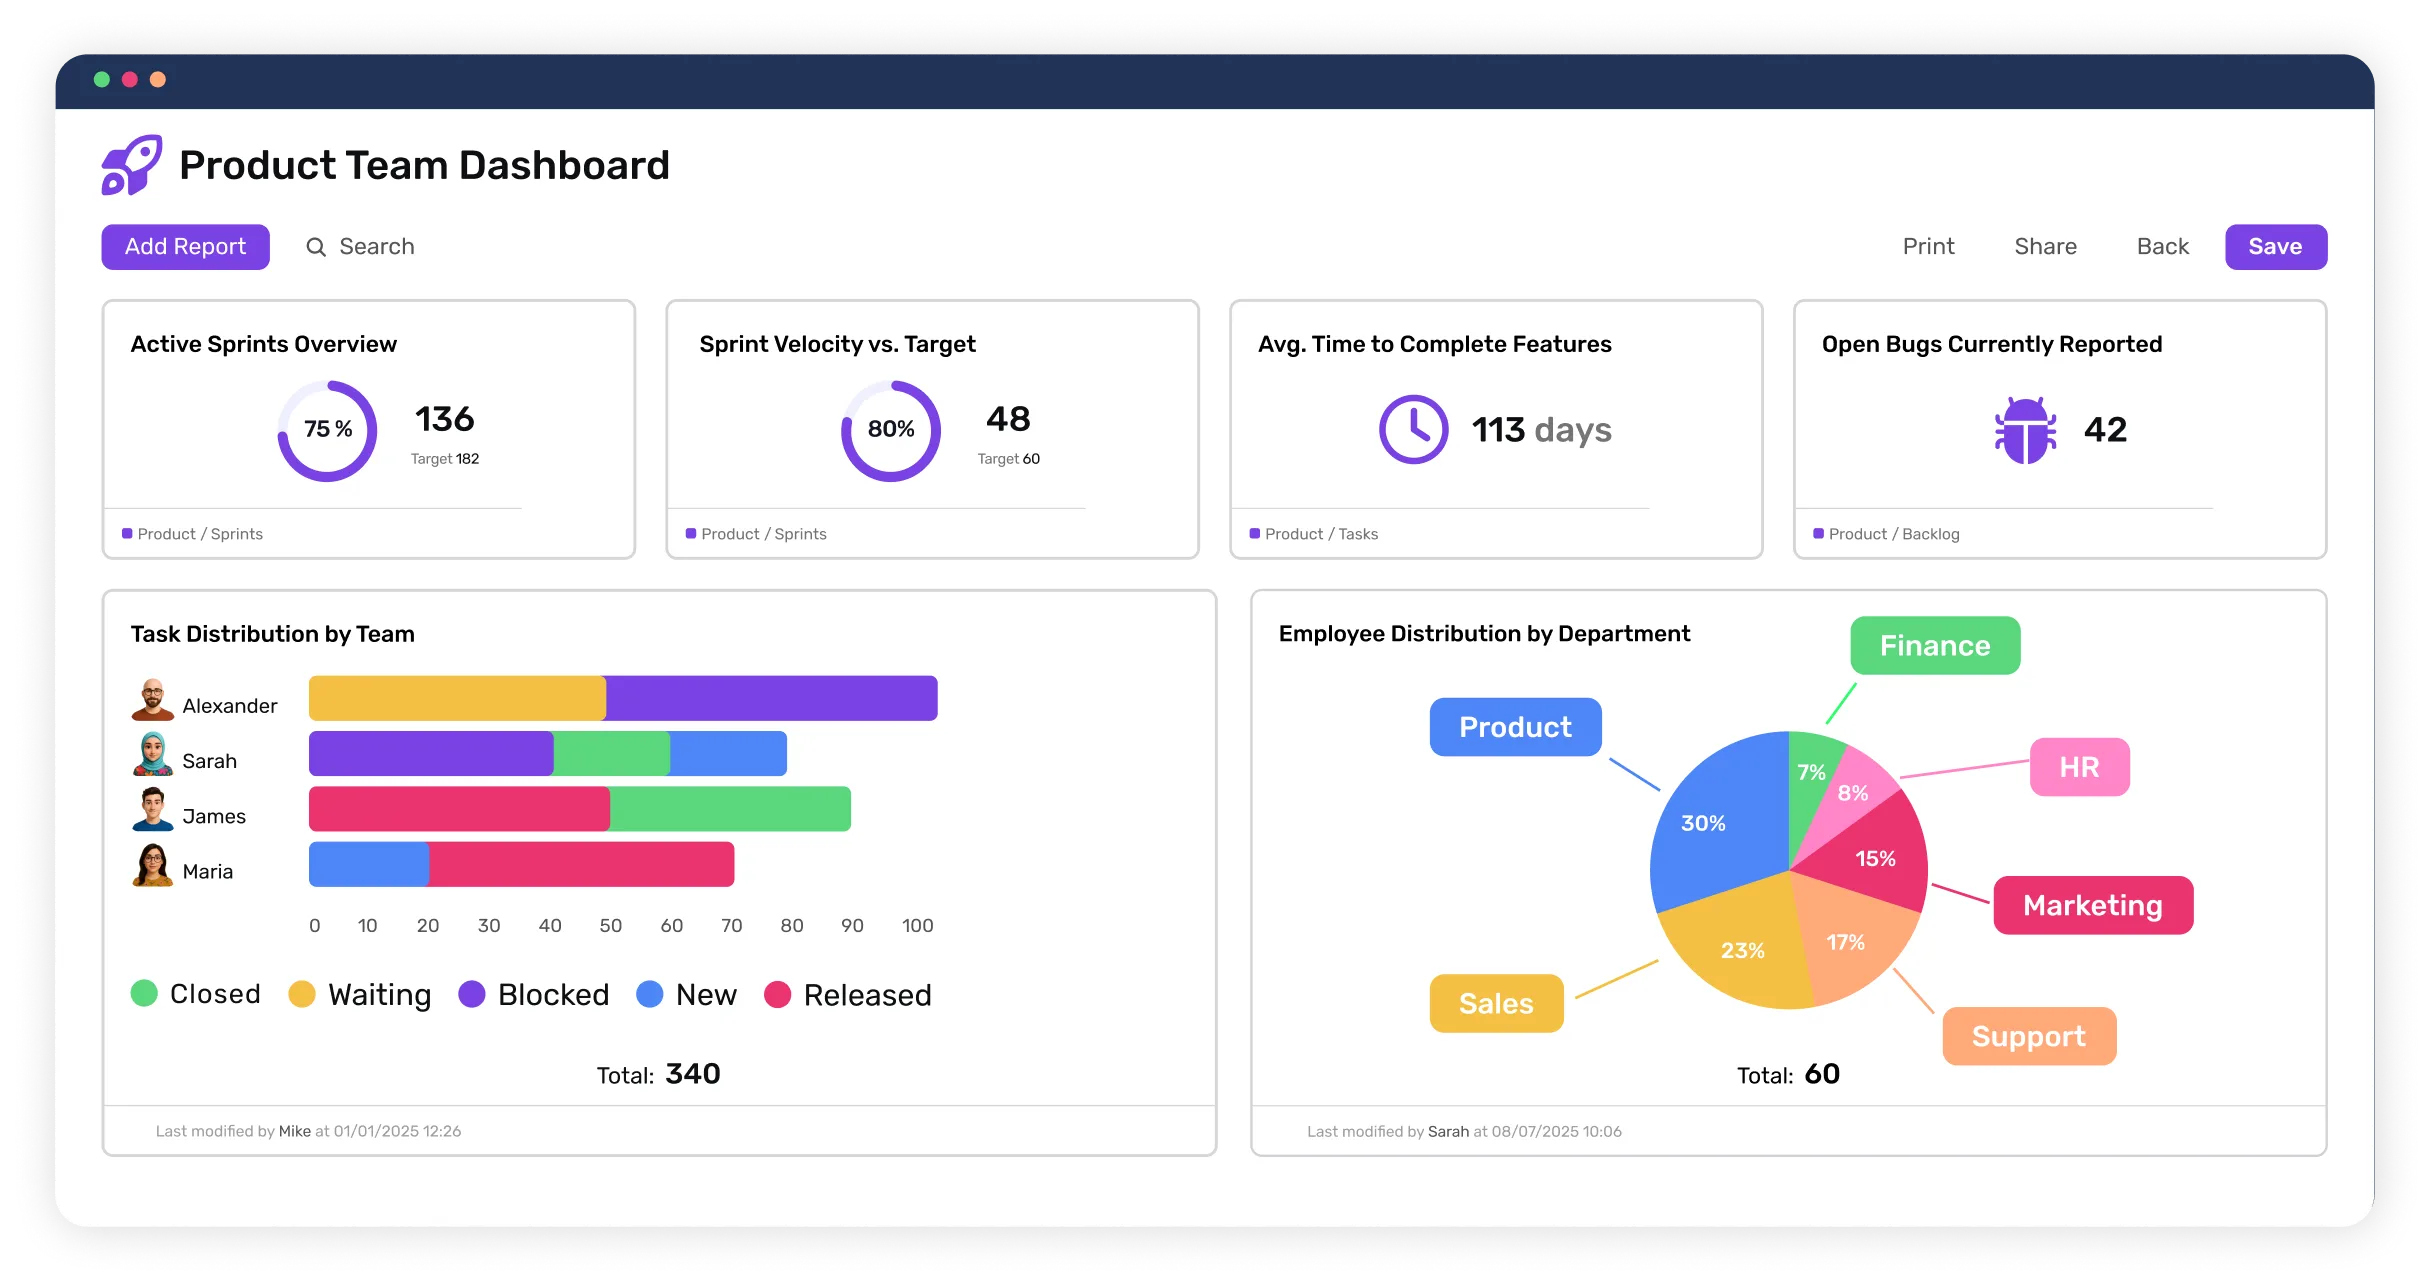
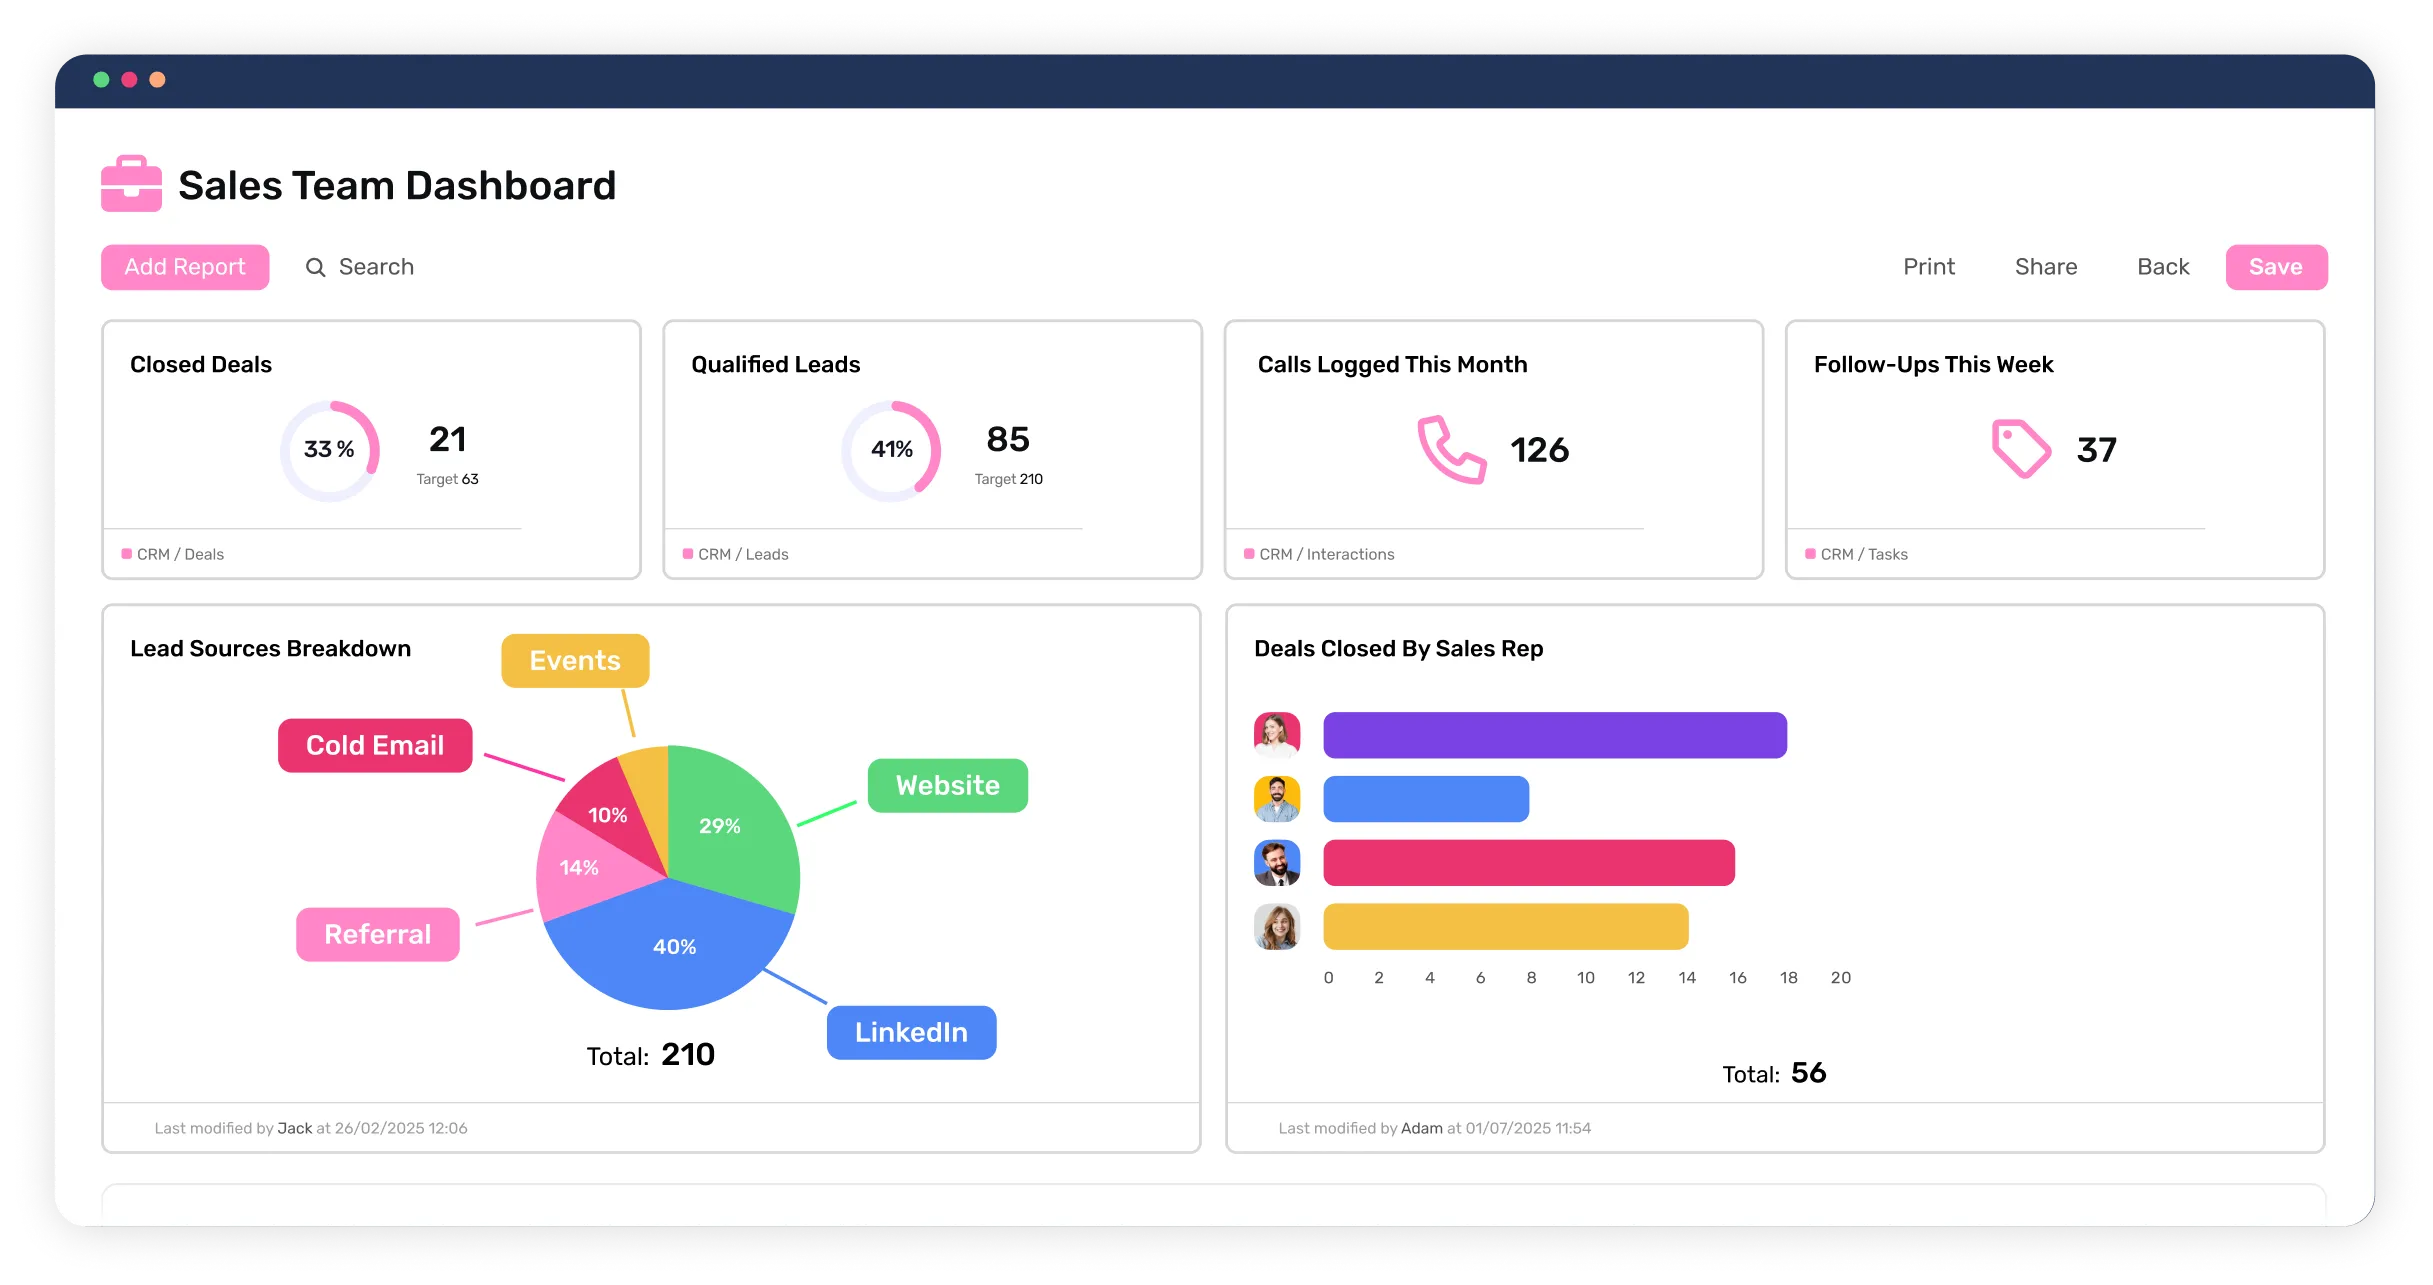
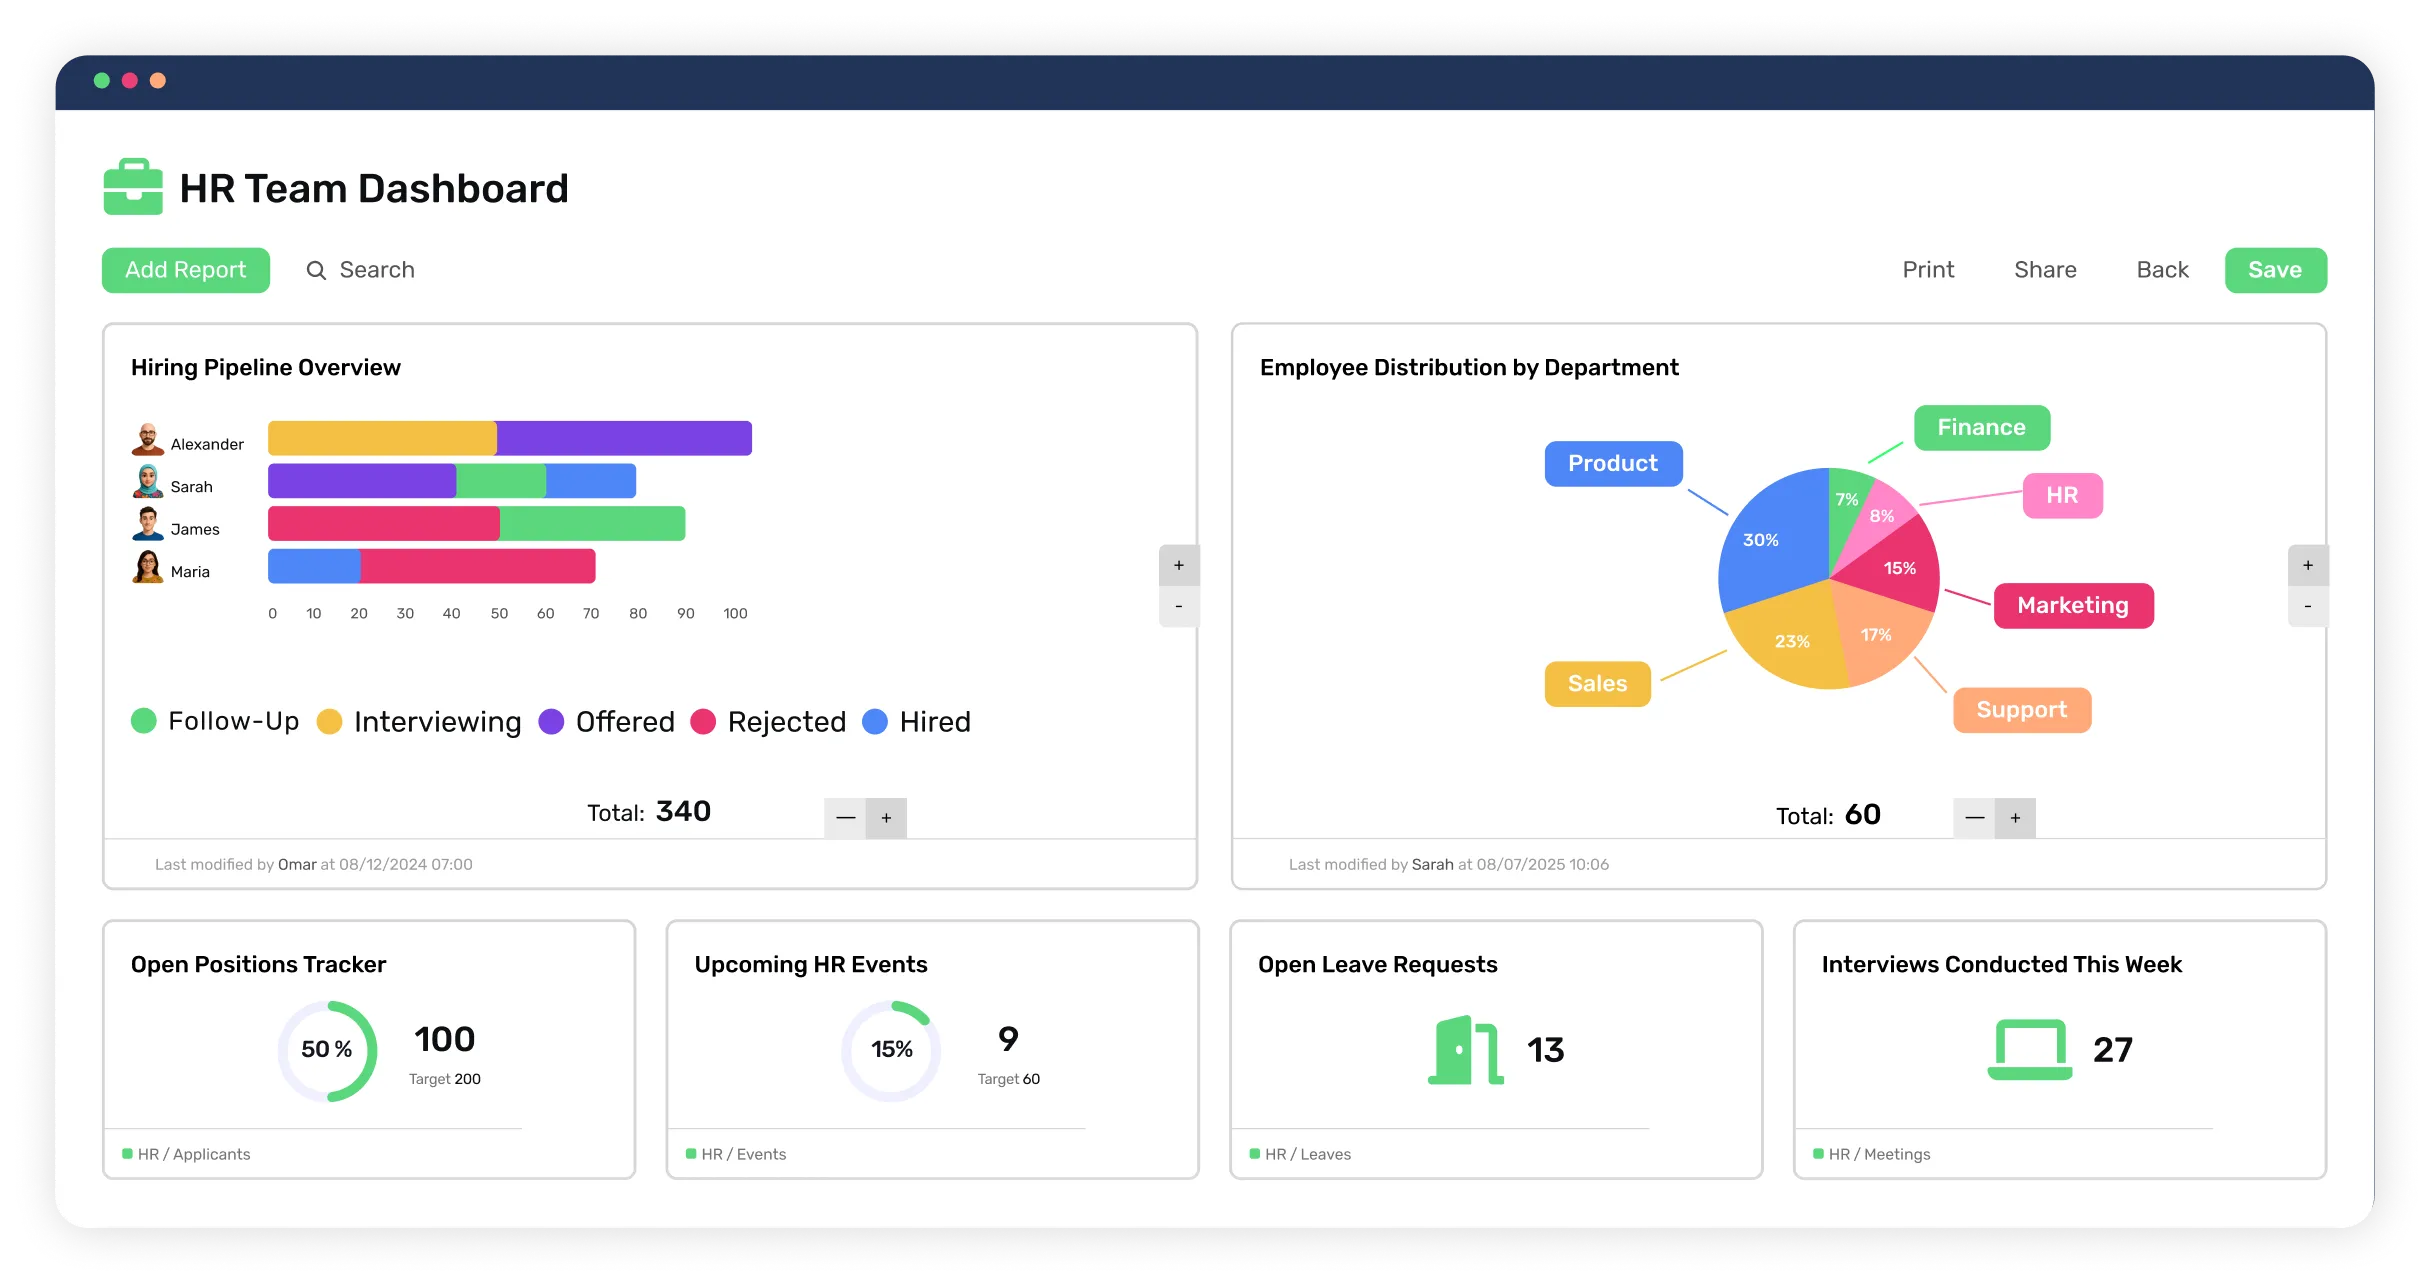
Transform data into actionable insights with Workiom's user-friendly dashboards, start making decisions accurately.

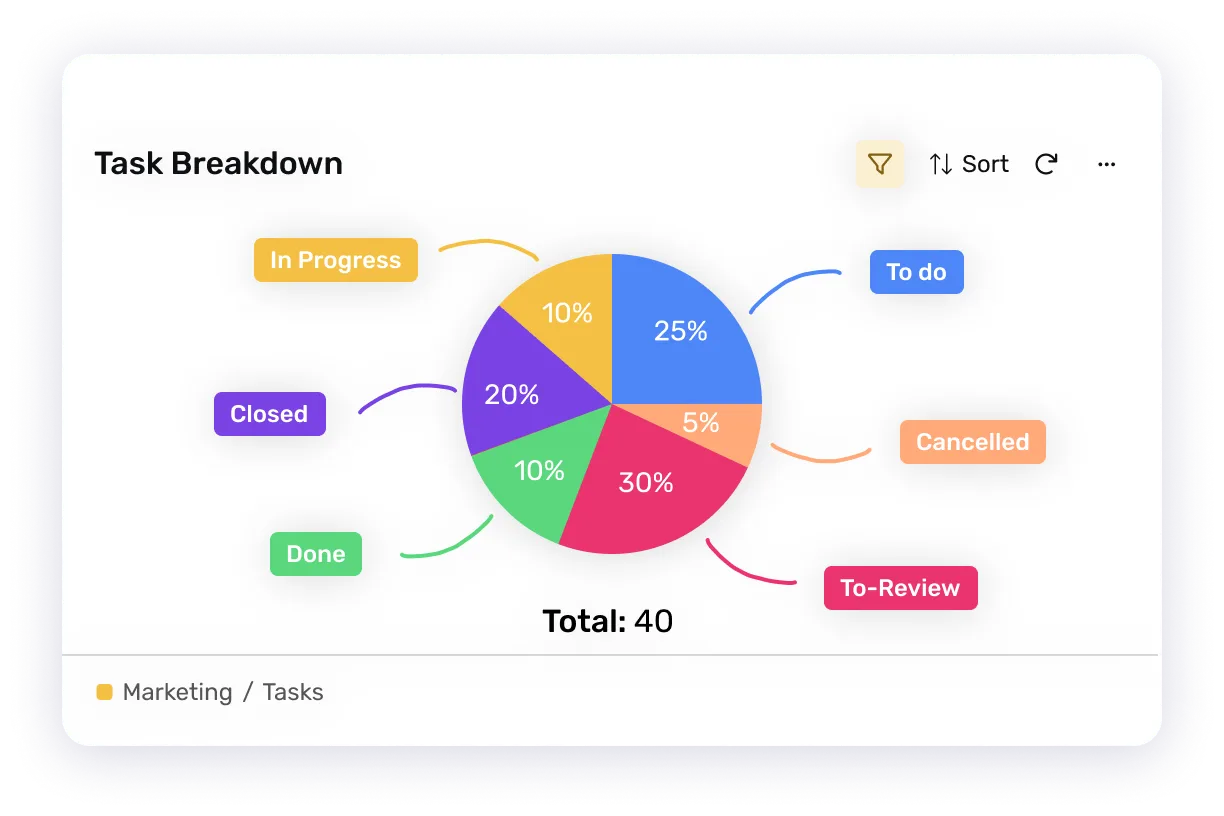
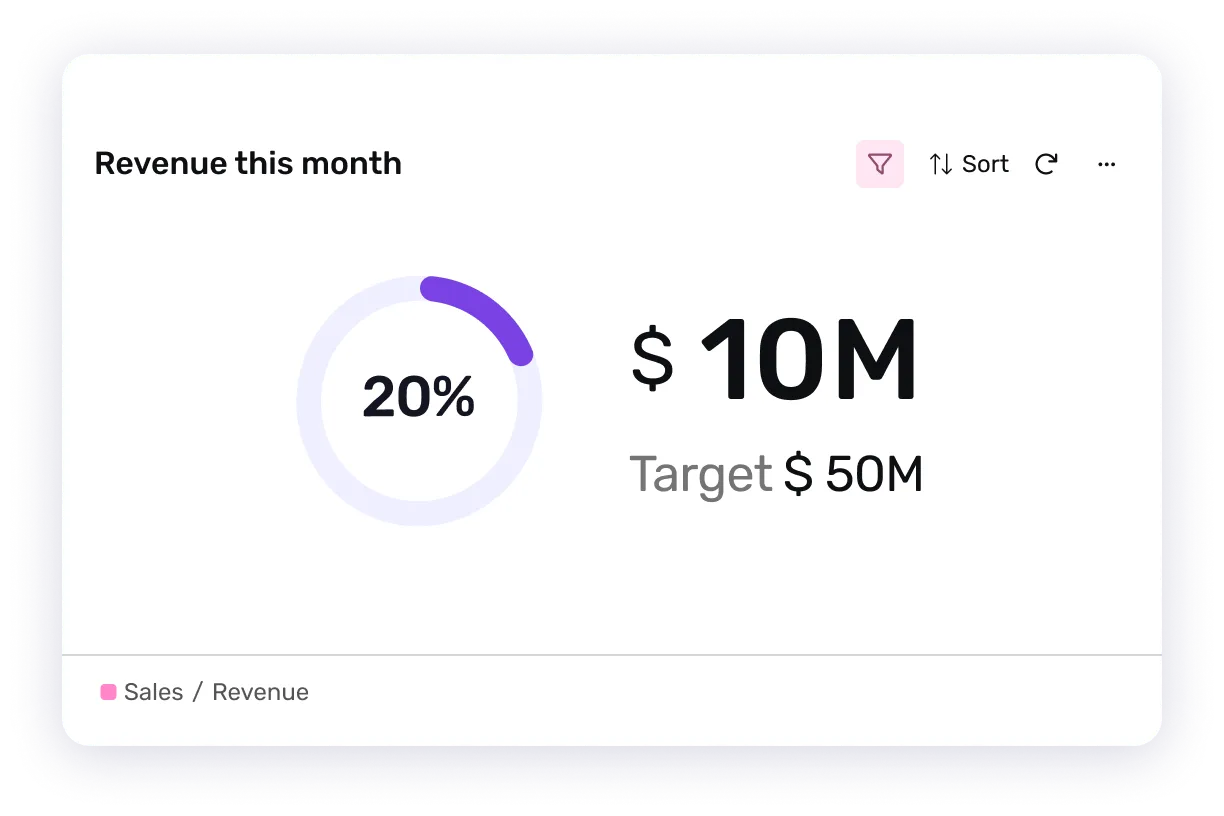
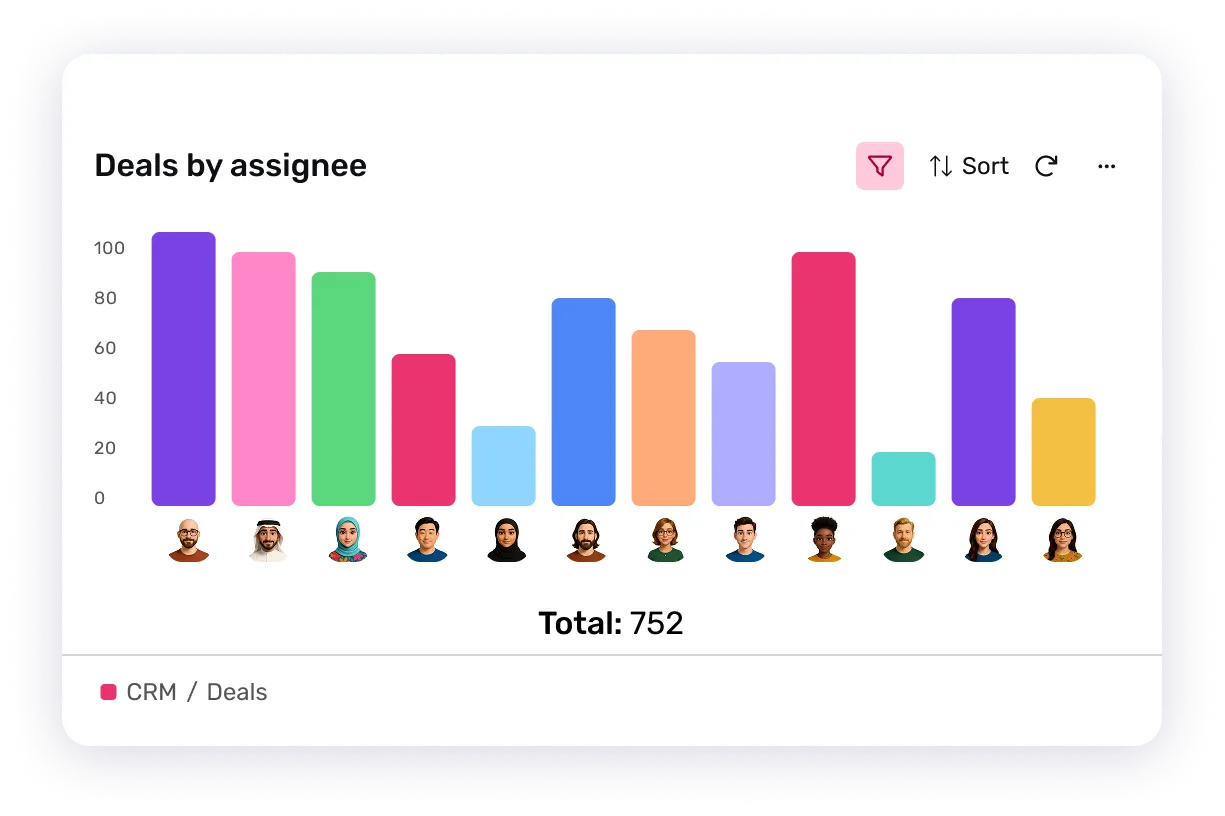
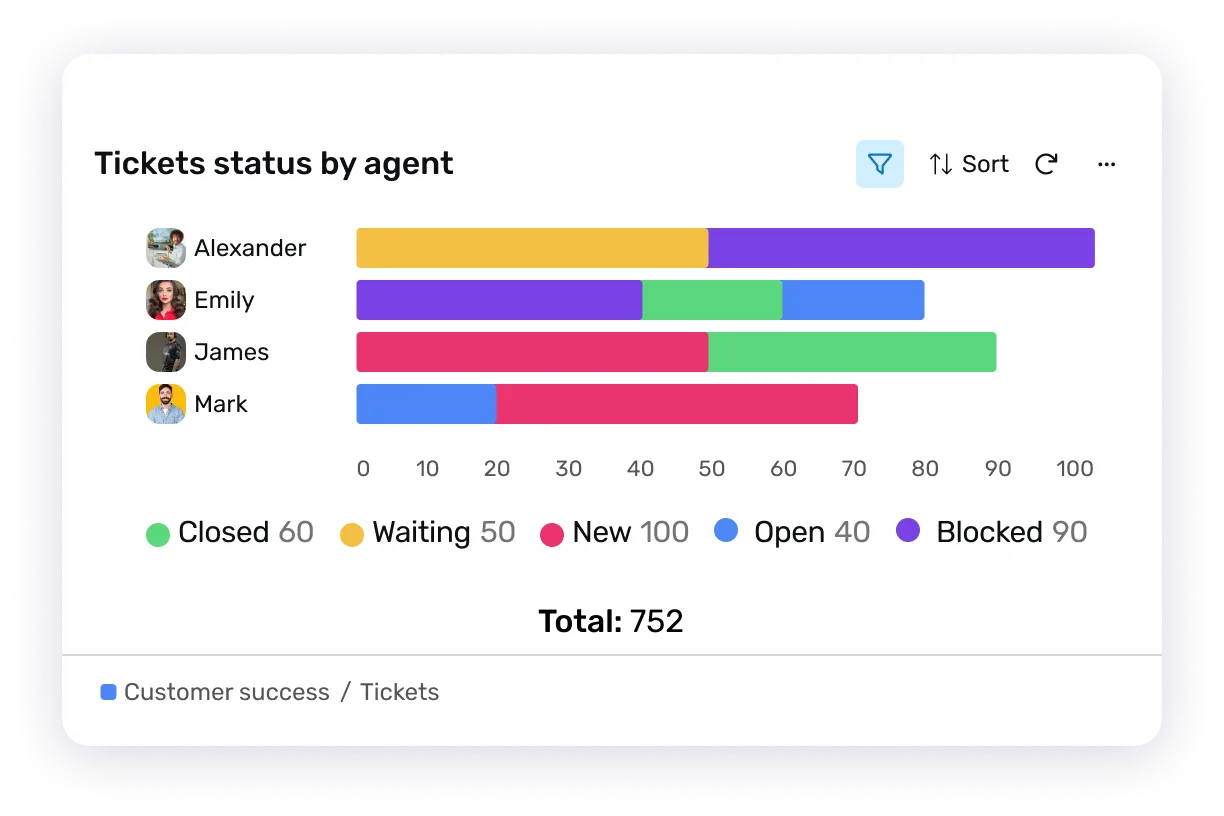

Consolidate crucial reports and gain swift insights from one centralized location.
Start your 14-day free trial now, no credit card required!
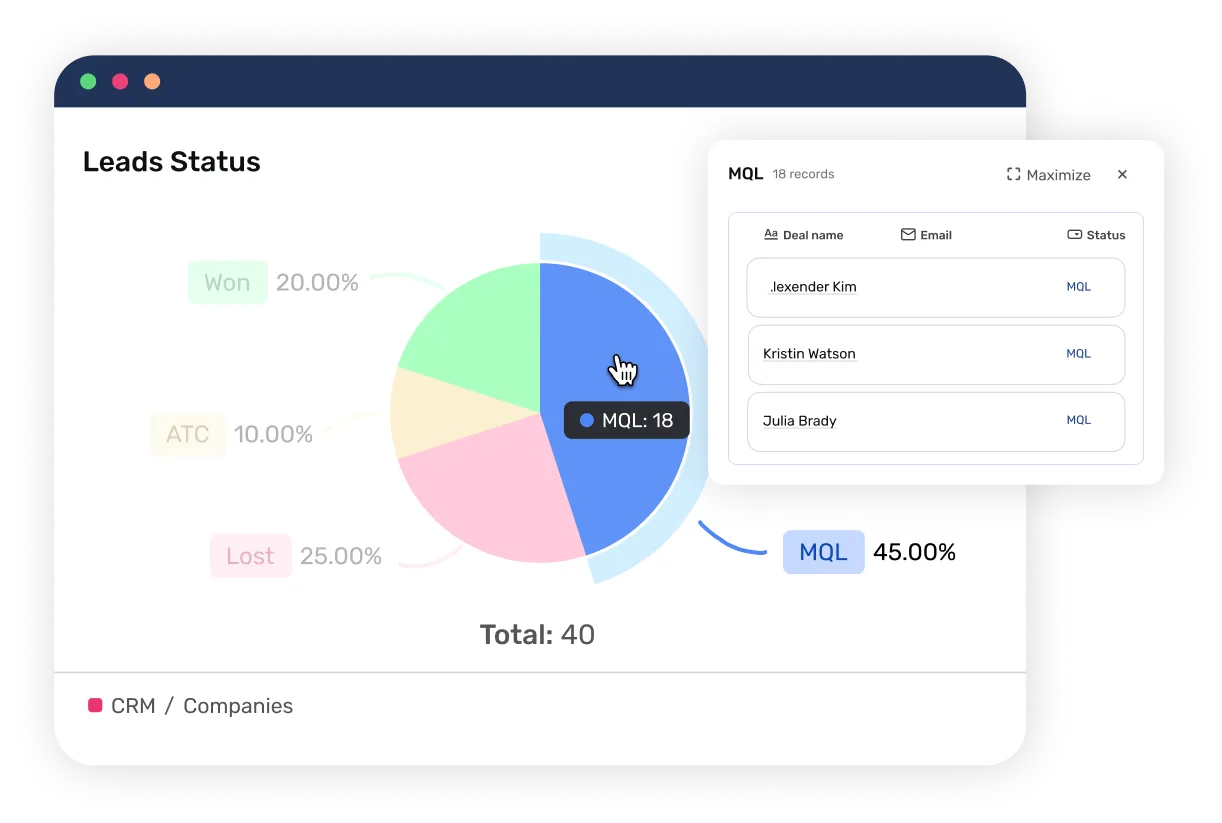
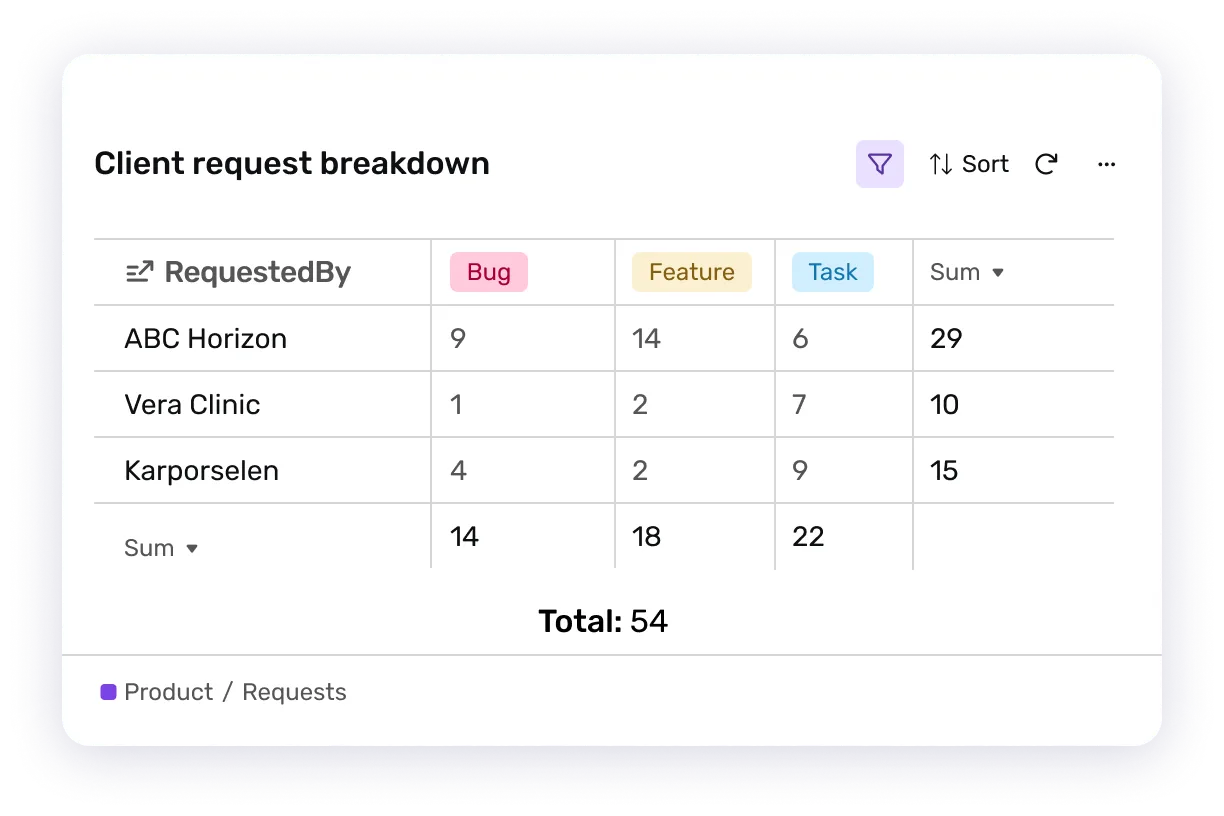
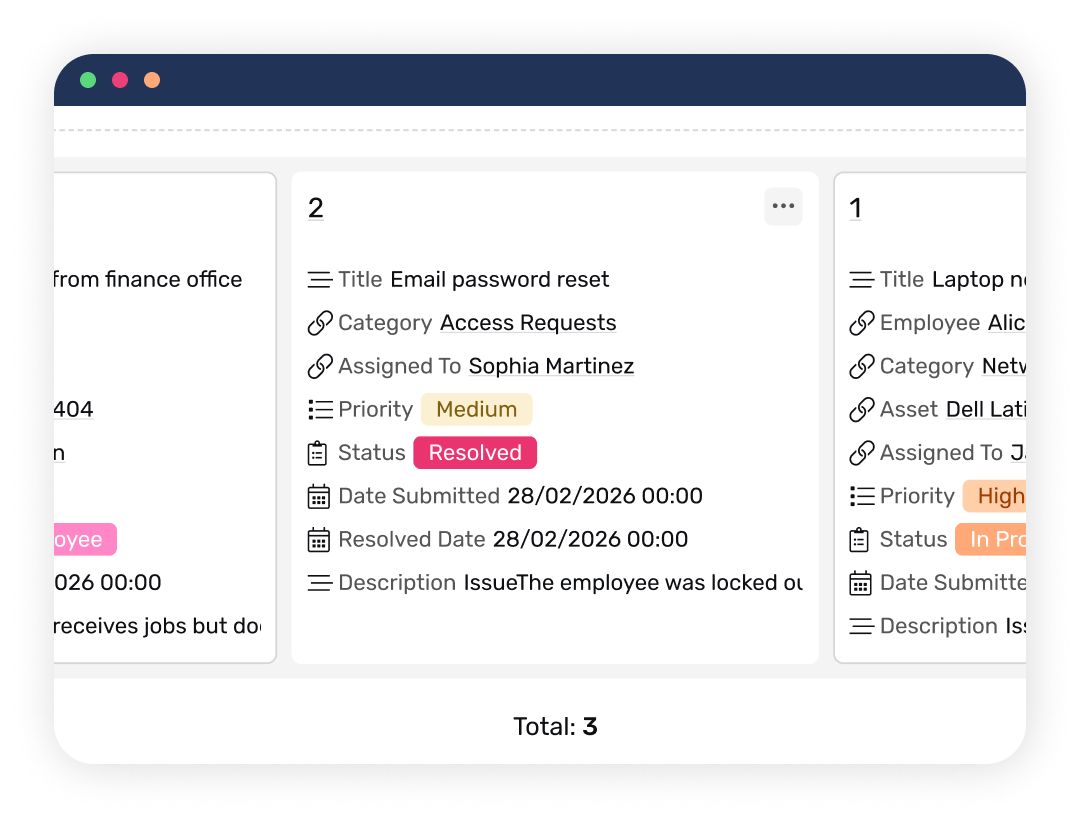
Dive deep into your records swiftly and understand the constituents of your reports effectively.
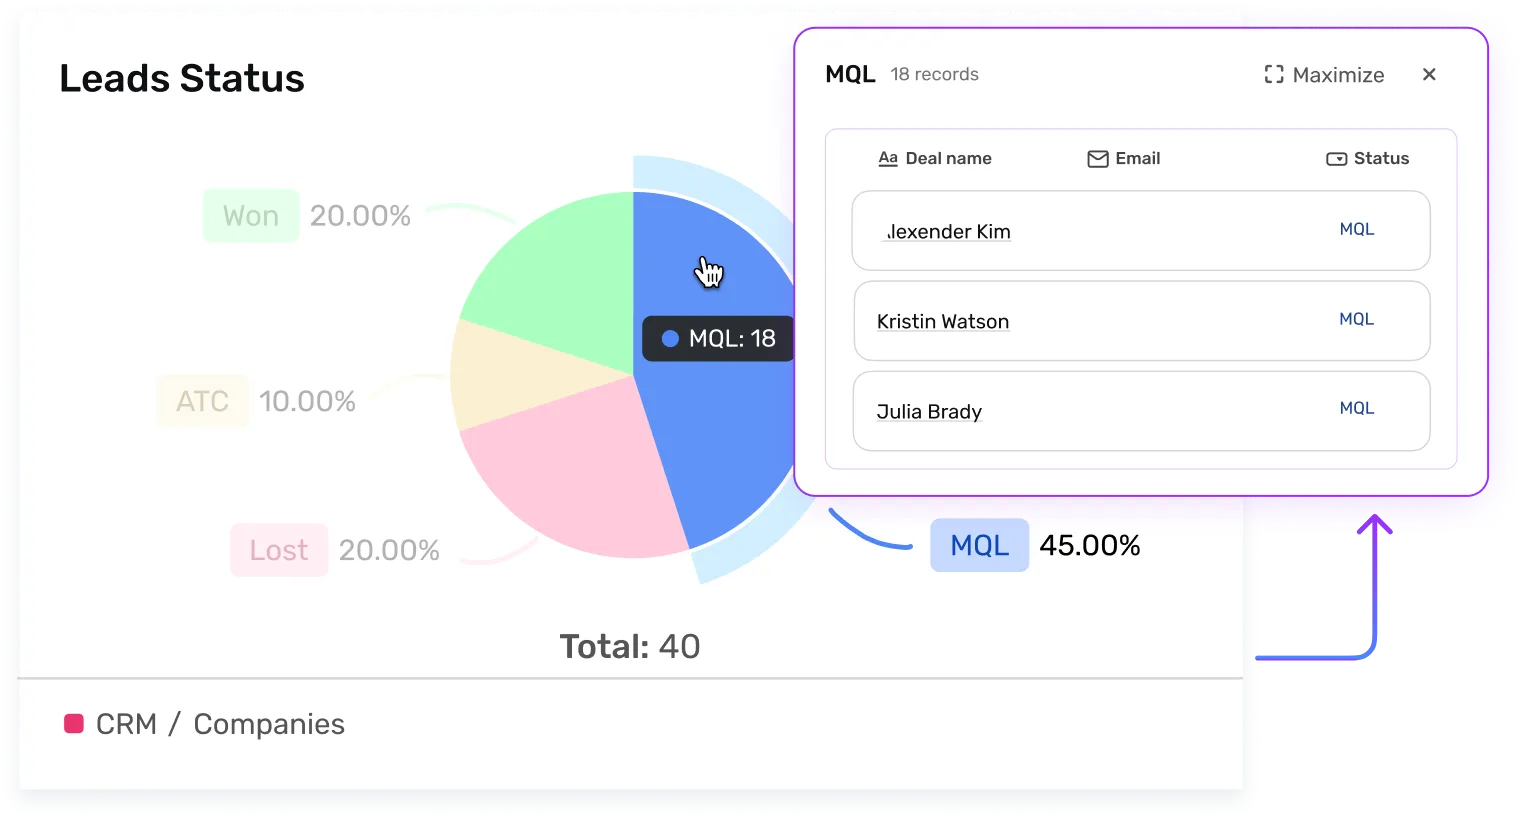
Enhance your reports with time-based grouping options and powerful filter combinations.

Watch how Workiom turns raw data into real-time insights: visually, clearly, and effortlessly.
Explore our no-code features that will elevate your workflows and make those big decisions confidently!
Collaborate with your team as you work on your daily tasks, with features like comments, replying, activities & more!
Automate your workflows, get in touch with your team with smart notifications, automated emails, and SMS.

Quick search & advanced filter. table, board and calendar views, choose what suits your project more!
Try out all features with a 14-day free trial account now without the need for credit card credentials!

.svg)

.svg)
.svg)